Every algorithmic trader has the duty to invent an indicator sooner or later, so here's now my contribution, the Market Meanness Index.
var MMI(vars Data,int TimePeriod)
{
	var m = Median(Data,TimePeriod);
	int i, nh=0, nl=0;
	for(i=1; i<TimePeriod; i++) {
		if(Data[i] > m && Data[i] > Data[i-1])
			nl++;
		else if(Data[i] < m && Data[i] < Data[i-1])
			nh++;
	}
	return 100.*(nl+nh)/(TimePeriod-1);
}
As the name says, this indicator measures the meanness of the market. The theory behind it is that in a completely uncorrelated price series, the probability of a price to revert to the mean is exactly 75%. That means if the current price is above the median price, the next price will be below the current price; and if the current price is below the median price, the next price will be above the current price. This rule is fulfilled for 75% of all prices of an uncorrelated price series. The proof of the 75% is relatively easy.
Real prices are more or less autocorrelated, so the probability of a real price series to revert to the mean is less than 75%, but normally more than 50%. The higher it is, the meaner is the market.
How can this be used for trading? The meanness index can determine when trend following systems become more profitable (market gets less mean) or less profitable (market gets meaner). For instance, you can use the rise or fall of the MMI to filter out unprofitable periods in the simple trend following system of workshop 4:
function run()
{
	vars Price = series(price());
	vars Trend = series(LowPass(Price,500));

	Stop = 4*ATR(100);

	vars Meanness = series(MMI(Price,200));
	vars Filter = series(LowPass(Meanness,500));

	if(valley(Trend)) {
		exitShort();  // close opposite position
		if(falling(Filter))
			enterLong();
	} else if(peak(Trend)) {
		exitLong();
		if(falling(Filter))
			enterShort();
	}
}
Here's the profit curve without meanness filter - AR 40%:
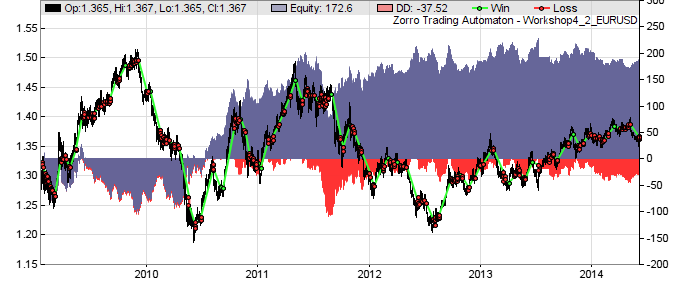
And here with meanness filter - AR 200%:

Enjoy!


")


