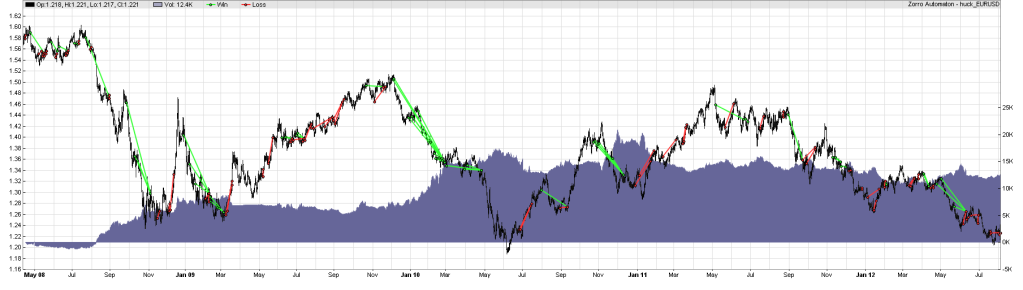
// Huck Trend Catcher
function HTCS()
{
	var *Price = series(price());
	var *LP5 = series(LowPass(Price,5));
	var *LP10 = series(LowPass(Price,optimize(10,6,20)));
	var *RSI10 = series(RSI(Price,10));
	Stop = optimize(5,1,10)*ATR(30);
	static int crossed = 0;

	if(crossOver(LP5,LP10))
	  crossed = 3;
	else if(crossUnder(LP5,LP10))
	 crossed = -3;

	if(strstr(Algo,":L") and crossed > 0 && crossOver(RSI10,50))
	{
	enterLong();
	 crossed = 0;
	}
	else if(strstr(Algo,":S") and crossed < 0 && crossUnder(RSI10,50))
	{
	enterShort(); crossed = 0;
	}
	else crossed -= sign(crossed);
}
function run()
{
	Mode = PARAMETERS+TESTNOW+FACTORS;
	BarPeriod = 240;
	StartDate = 2006;
	NumYears = 7;
	NumWFOCycles = 12;


	if(ReTrain) {
		SelectWFO = -1;
		UpdateDays = 30;
	}

//Asset Classes
while(asset(loop("EUR/USD","USD/CHF","AUD/USD","USD/JPY","GBP/USD","USD/CAD","NZD/USD","AUD/JPY","")))

while (algo(loop(":L",":S")))
{
	if(Train)
	Lots=1;
	else if(strstr(Algo,":L") and OptimalFLong > 0)
	{
	Lots=1;
	Margin = clamp((WinLong-LossLong) * OptimalFLong/2,50,1000);
   }
   else if(strstr(Algo,":S") and OptimalFShort > 0)
   {
   Lots=1;
   Margin = clamp((WinShort-LossShort) * OptimalFShort/2,50,10000);
   }
	else
	Lots=0;

	HTCS();
}
}


")