Hey guys,
as I received a lot of help – I want to share a my “fresh” simple custom indicator with you. I have not yet used it for trading. But maybe soon…
// Envelope Channel
#include <default.c> 	// see http://www.zorro-trader.com/manual/en/include.htm
var ECDeviation; 	// custom parameter for deviation of the bands (could be two diff.)
int SMA_Period;	// period of the SMA
var EChannel(var* Data, int SMA_Period, var ECDeviation)		// usual function calling
{
	rRealUpperBand = (SMA(Data, SMA_Period) * (1 + ECDeviation/100));	// “official” formula
	rRealLowerBand = (SMA(Data, SMA_Period) * (1 - ECDeviation/100));	// same
	return rRealUpperBand;						// like DC indicator
}
Afterwards i just expanded the “Donchian Channel Indicator” but it still took me some time to code it.
Step by step:
1. Create a file name “myindicator_1.c” in the Zorro/Include folder
2. Copy the posted code and save file
3. Add #include <myindicator_1> at the beginning of your script
4. Call the function via EChannel(var* Data, int SMA_Period, var ECDeviation) with your individual paramters.
5. The function returns both bands, which you can then plot f.e.
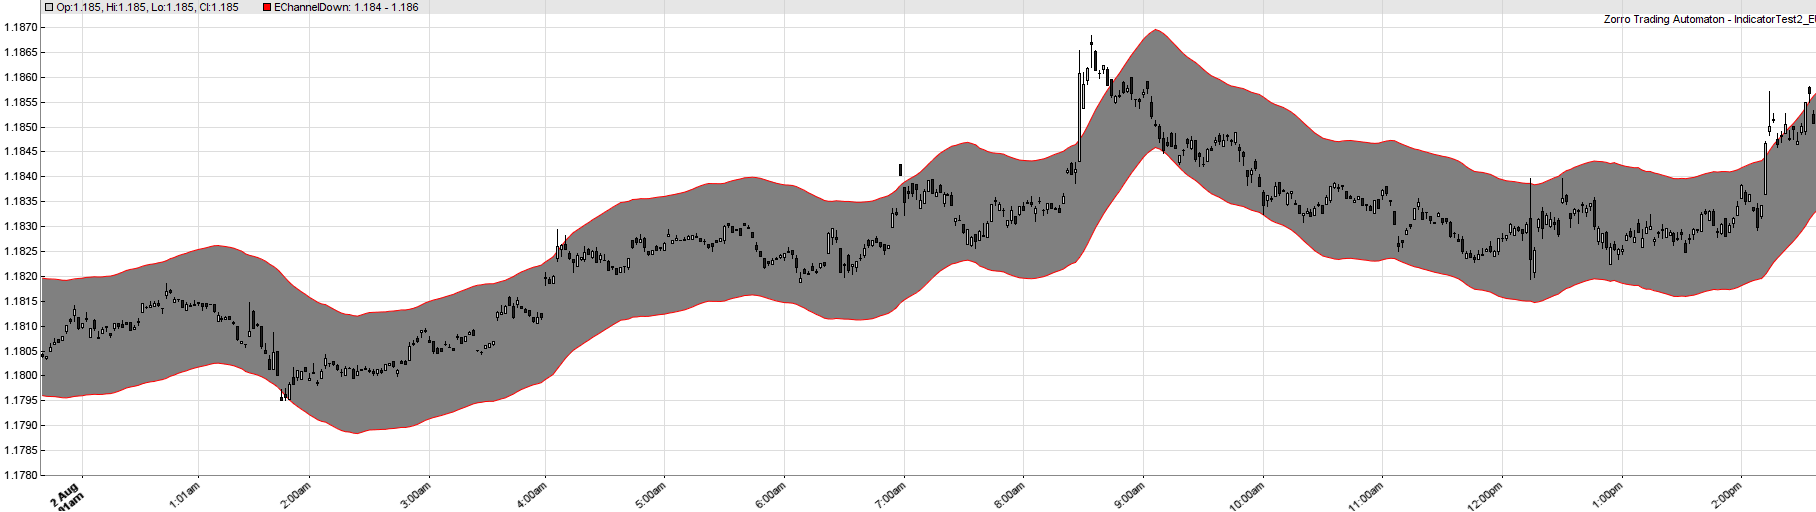
Example:
// IndicatorTest2 ///////////////////
#include <myindicators.c>
function run()
{
	set(PLOTNOW);
	StartDate = 20170802;
	BarPeriod = 1;
	vars Price = series(price());

// plot Envelope Channel
	EChannel(Price,20,0.1);
	plot("EChannelUp",rRealUpperBand,BAND1,RED);
	plot("EChannelDown",rRealLowerBand,BAND2,GREY);
}
I know, this indicator is nothing special. But i didnt find a good example for a custom indicator usage somewhere.
P.S. i hope everything is done "efficient" and feel free to comment


")