Strategies based on Ehlers' work

Posted By: boatman

Strategies based on Ehlers' work - 10/15/14 06:56

Hi everyone

The purpose of this thread is to start a discussion and hopefully some collaboration around the work of John Ehlers. I have been reading a lot of his work the last couple of months, and I am very interested in pursuing it further. It appeals because it has a solid theoretical foundation.

I'll kick things off with his "Even Better Sine Wave" (EBSW) as described in "Cycle Analytics for Traders". The EBSW is a variant of his Roofing Filter, but uses a single-pole high pass filter connected to the super smoother. After the data is filtered, the 3-bar average wave amplitude and power are calculated and the output is then computed by normalizing the averaged amplitude to the square root of the average power. The result is an oscillator-style indicator that swings between +1 and -1.

Here is my code (comments and suggestions much appreciated):

Code:
// =====EHLERS' EVEN BETTER SINEWAVE=====

function run()
{

//High pass filter cyclic components whose periods are shorter than duration input
vars Price = series(price());
var Duration = 40; //optimize(40, 10, 100); //max length of trend trade
vars HP = series(HighPass1(Price, Duration));

//Smooth with super smoother
vars Filter = series(Smooth(HP, 10));

//3-bar average of wave amplitude and power
vars Wave = series((Filter[0] + Filter[1] + Filter[2])/3);
vars Pwr = series((Filter[0]*Filter[0] + Filter[1]*Filter[1] + Filter[2]*Filter[2])/3);

//Normalize average wave amplitude to square root of the average power
vars ebsw = series(Wave[0]/sqrt(Pwr[0]));
plot("ebsw", ebsw, NEW, RED);

}


Attached is a chart showing what it looks like (EUR/USD daily bars from 2012).

The only input parameter is the cutoff period of the single-pole highpass filter (Ehlers' default is 40). Longer periods cause the oscillator to swing less frequently. Ehlers interprets the cutoff period as being something like the maximum expected trend duration - but I don't see how you can "expect" the duration of a trend! Seems more sensible to optimize this parameter over a robust range of values in a trading system.

Ehlers says "hold a long position when the indicator value is near +1 and hold a short position when it is near -1." Obviously this is not enough to create a trading system, and the indicator is much more useful when the market is trending, as opposed to cycling.

I think this filter could have an application in a system that follows trends, but it needs additional filters to really make it useful.

I'd love to hear what others think of this!

Attached picture EBSW.png
Posted By: scotpip

Re: Strategies based on Ehlers' work - 10/15/14 09:10

I'm up for this - Ehlers does seem one of the most interesting innovators in the field.

For anyone who'd like to get an overview of what he's up to, here's a non-technical seminar where he explains what he feels his approach offers.

https://www.youtube.com/watch?v=BR5pDiPYsnw

My maths is limited, so I won't be able to help much with coding up new indicators, but I'm happy to feed back any insights from our experiments.

A quick question - do we have the latest MESA filters that are in the public domain? If not, is there any way we could get them into Lite-C?
Posted By: boatman

Re: Strategies based on Ehlers' work - 10/15/14 11:31

Hey scotpip, fantastic that you are interested in this! Thanks for sharing the link, I'm watching it as I type this.

Regarding the latest MESA filters - do you mean these ones? http://www.mesasoftware.com/technicalpapers.htm Most of those are available in Zorro, or are able to be assembled using the existing tools in Zorro.
Posted By: boatman

Re: Strategies based on Ehlers' work - 10/15/14 12:52

Just finished watching the video that scotpip shared. It is a recording of Ehlers explaining some of the key points from his most recent book "Cycle Analytics for Traders". Even if you've read this book and understood the material, I highly recommend watching the video. Ehlers explains some of the important concepts very clearly and it can only help increase comprehension.
Posted By: boatman

Re: Strategies based on Ehlers' work - 10/15/14 12:59

Also, Ddlv coded some of Ehlers' filters here - http://www.opserver.de/ubb7/ubbthreads.p...true#Post430829
Posted By: scotpip

Re: Strategies based on Ehlers' work - 10/15/14 22:03

Hi boatman

Glad you found the video worth watching.

The latest version of MESA is MESA9l, I think. You can get the suite for Tradestation, eSignal and NeuroShell. I wonder if he'd sell a dll for more general use?

http://www.mesasoftware.com/mesa.htm

I'd imagine the MESA9 formulae are still proprietary. My gut feel is that the general principles will be more important than the latest tweaks, but it would be nice to have the latest version that's openly published. I'm waiting for the new book on inter-library loan. I understand there's a fair bit of EasyLanguage code in there. Is there an updated MESA?

I won't be able to follow the maths, but the reviews suggest you can still pick up a lot from it. Do you have the background to understand the detail?

Thanks for the heads-up on DdIV's post. Pretty impressive result, for a 24 hour candle traded on a slow instrument without filters or stops! Most hedge funds would kill for a return like that... And all in 14 lines of code, including charting and logging. You've got to love Zorro!

I'm going to have a little play with DdIV's strategy and your EBS indicator...

Posted By: boatman

Re: Strategies based on Ehlers' work - 10/16/14 04:09

Hey scotpip

I had a look a the mesa software website, and it seems that some of those indicators are discussed in the latest book, but not all of them. He talks about different methods for analysing spectra, plus you get the code for the detrender and instantaneous trendline (he calls it a 'decycler').

If you do want to gain a good understanding, my advice is don't be put off by the maths. I have an engineering and science background, so it wasn't foreign to me. But I can also say honestly that it is not as high powered as it might seem. You only really need to get your head around the basics of complex numbers, differential calculus and trigonometry to follow Ehlers' methodologies. Also it helps to be familiar with the fundamental characteristics of waves (amplitude, period, frequency, phase etc). There are online tutorials that would get you up to speed in a few days to a week. I think its well worth it.

Also, I'd be more than happy to try to answer any questions about Ehlers' methods. It would help my own understanding as well.

Cheers
Posted By: scotpip

Re: Strategies based on Ehlers' work - 10/16/14 09:53

Well, if you ever get the chance to code any of them up, it would great to try them. I might give it a go myself once I'm a bit more fluent with Lite-C and Easy Language.

Long time since I've done any serious math (apart from stats), but with your encouragement I'll give it a try. I've got some calc and trig but I'd have to bone up on number theory. The signal processing concepts I've grokked on the web - not too scary.

I may well take up your offer to help if I get stuck. As you say, teaching someone is often a good way to clarify your own thoughts.

How are you finding his indicators in terms of practical strategy development? Any promising results?
Posted By: boatman

Re: Strategies based on Ehlers' work - 10/16/14 11:34

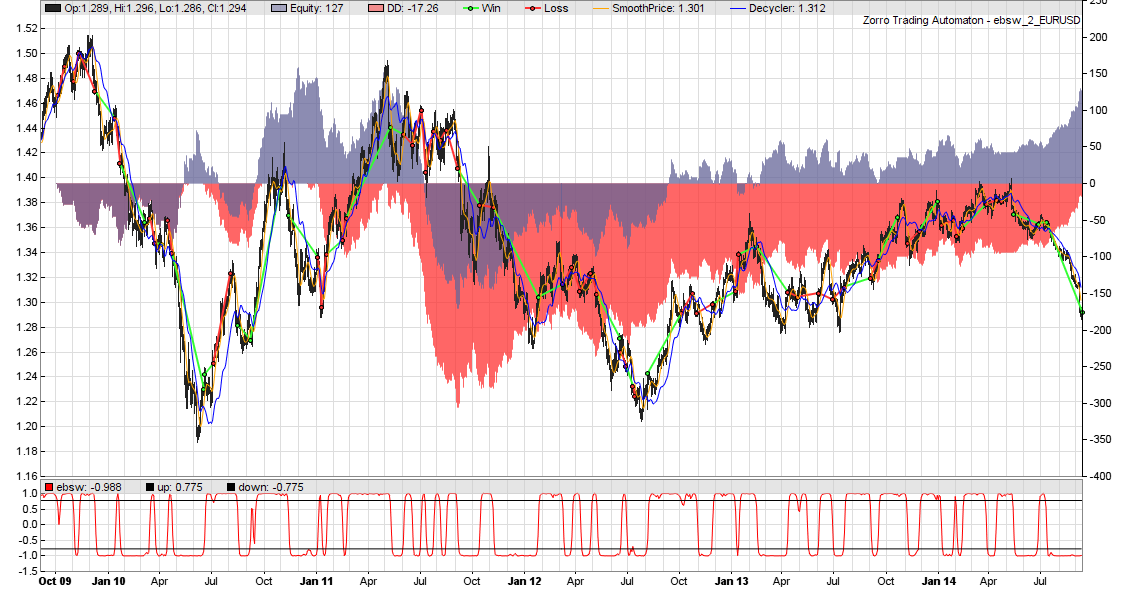
Yeah, definitely some promising results. I've been playing around with the Even Better Sine Wave indicator as the basis of a system. It has some potential I think, particularly in catching and sticking with a trend. Here's a description of the system:

Buy when the EBSW crosses over some lower threshold from below.
Sell when the EBSW crosses under some upper threshold from above.
Exit if the super-smoother filtered price crosses the 'decycler' or instantaneous trendline.

Here's the code:

Code:
// =====EHLERS' EVEN BETTER SINEWAVE SYSTEM=====

function run()
{
set(PARAMETERS+TICKS);
NumSampleCycles = 6; 

//High pass filter cyclic components whose periods are shorter than duration input
vars Price = series(price());
vars SmoothPrice = series(Smooth(Price, 10));
var Duration = optimize(40, 20, 70); //max length of trend trade
vars HP = series(HighPass1(Price, Duration));
plot("SmoothPrice", SmoothPrice, 0, ORANGE);

//Smooth with super smoother
vars Filter = series(Smooth(HP, 10));

//3-bar average of wave amplitude and power
vars Wave = series((Filter[0] + Filter[1] + Filter[2])/3);
vars Pwr = series((Filter[0]*Filter[0] + Filter[1]*Filter[1] + Filter[2]*Filter[2])/3);

//Normalize average wave amplitude to square root of the average power
vars ebsw = series(Wave[0]/sqrt(Pwr[0]));

////Decycler
var HPCutoff = optimize(40, 10, 60, 5);
vars HP = series(HighPass(SmoothPrice, HPCutoff));
vars Decycler = series(SmoothPrice[0] - HP[0]);
plot("Decycler", Decycler, 0, BLUE);

//Trade paramters
var threshold = optimize(0.8, 0.7, 0.95, 0.025);
vars Signals = series(0);

Stop = 4*ATR(20);

if (crossOver(ebsw, -threshold)) 
	enterLong();
if (crossUnder(ebsw, threshold)) 
	enterShort();
	
if (crossUnder(SmoothPrice, Decycler))
	exitLong();
if (crossOver(SmoothPrice, Decycler))
	exitShort();

plot("ebsw", ebsw, NEW, RED);
plot("up", threshold, 0, BLACK);
plot("down", -threshold, 0, BLACK);

}


Optimised performance on EUR/USD attached. As you can see, not tradeable in its current form, but it does give some timely trend trade signals. Notice that the losing periods are generally when the market is going sideways, or cycling. To me this suggests that somehow filtering these sideways periods could improve performance considerably.

What do you think? Any ideas?

Attached picture EBSW.png
Posted By: scotpip

Re: Strategies based on Ehlers' work - 10/16/14 16:16

Hi

Thanks for posting. No time today, but will play tomorrow.

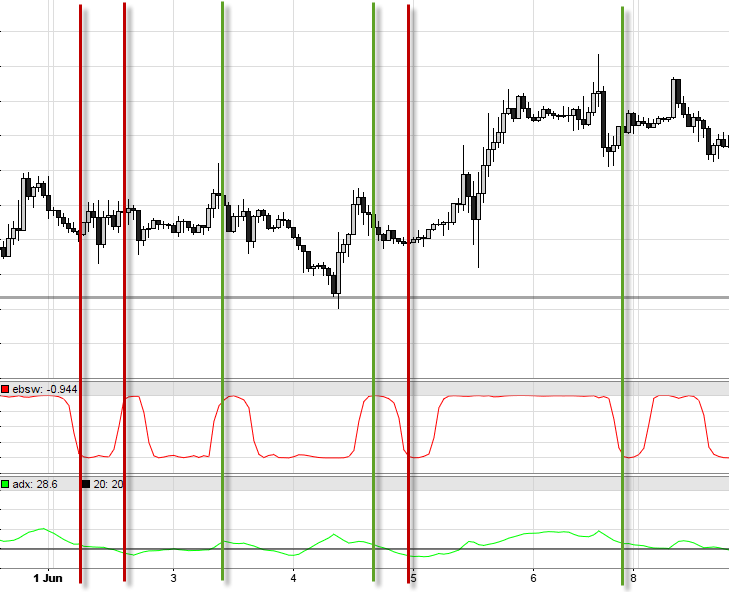
With old-style indicators I've found that ADX is pretty good at keeping you out of the rough stuff - varies by instrument but under 20-25 or very low and falling are usually signs you don't want to be trading. Nothing new, but I do find it works well.

In the attachment these two rules do a pretty good job of filtering out the nasty signals (red lines) and leaving in the wins(green) (GBPUSD). Not cherry picked - simply the start of chart.

I'm hoping that there's an Ehlers momentum indicator that will be a step forwards, though? Anything you think is worth looking at?

Attached picture Ehler ADX filter.png
Posted By: boatman

Re: Strategies based on Ehlers' work - 10/17/14 09:44

Thanks for sharing the ADX. I had a play with it, but from what I could tell, in the long run it didn't really discriminate between filtering good trades and bad trades. I tried tuning it to both the dominant cycle period and half dominant cycle period, as well as a few other values, but couldn't seem to get much of value out of it. But that's OK, I think that testing and discarding what doesn't work is important, and all part of the game!

I have another idea I want to explore: identify a trend on a higher time frame, and then use cycle analytics on a lower time frame to find a good entry point. I'm not too sure about how to implement it just yet, but I'll keep working on it.

In terms of a momentum indicator, I believe that Ehlers uses one on his stockspotter website as a confirmation signal for cycle trades. I haven't looked into it too deeply though, and I assume that it would be proprietary information. Maybe we could have a go at developing something similar?
Posted By: scotpip

Re: Strategies based on Ehlers' work - 10/23/14 18:31

Sorry for the silence - been caught up in something else. I'll get back to you on this as soon as I can get some breathing space!
Posted By: boatman

Re: Strategies based on Ehlers' work - 10/27/14 10:17

All good mate, I too have been caught up in other things. Really keen to return to this sometime this week though.
Posted By: GPEngine

Re: Strategies based on Ehlers' work - 10/30/14 05:48

You redefine vars HP
Posted By: boatman

Re: Strategies based on Ehlers' work - 10/30/14 22:01

So I do! Thanks for pointing that out GPEngine. You have an eye for detail!
Posted By: scotpip

Re: Strategies based on Ehlers' work - 10/31/14 11:33

Made a bit of a breakthrough with our system using another approach - lots of work to do to get it trading, so Ehlers will be on the sidelines for a bit, I'm afraid. I'll keep watching this thread through - hope others join the fray...
Posted By: webradio

Re: Strategies based on Ehlers' work - 01/12/15 17:25

Posting "Ehlers' Even Better Sinewave", coded slightly differently (after his Code Listing 12-1 in his Cycle
Analytics for Traders). Tried to save some CPU time by calculating coefficients just once and creating couple of series less.
Code:
//Ehlers' Even Better Sine Wave
function run()
{
	var Duration = 40; //highpass
	var Cutoff = 10; //lowpass
	vars Price = series(price());

	static var alpha1,a1,b1,c2,c3,c1;
	if(is(INITRUN)) {
		alpha1 = (1 - sin(2*PI/Duration)) / cos(2*PI/Duration);
		a1 = exp(-1.414*PI / Cutoff);
		b1 = 2*a1*cos(1.414*PI / Cutoff);
		c2 = b1;
		c3 = -a1*a1;
		c1 = 1 - c2 - c3;
	}

	//High pass filter cyclic components whose periods are shorter than duration input
	vars HP = series(Price[0], 2);
	HP[0] = 0.5*(1 + alpha1)*(Price[0] - Price[1]) + alpha1*HP[1];
	//Smooth with a Super Smoother Filter
	vars Filt = series(HP[0], 3);
	Filt[0] = c1*(HP[0] + HP[1]) / 2 + c2*Filt[1] + c3*Filt[2];
	//3 Bar average of Wave amplitude and power
	//Normalize the Average Wave to Square Root of the Average Power
	vars EBSW = series(0, 1);
	EBSW[0] = ((Filt[0] + Filt[1] + Filt[2])/3)/sqrt((Filt[0]*Filt[0] + Filt[1]*Filt[1] + Filt[2]*Filt[2])/3);
	plot("EBSW", EBSW, NEW, RED);
}

© 2024 lite-C Forums