reproducing the trend test from "financial hacker"

Posted By: DeusExMachina

reproducing the trend test from "financial hacker" - 04/13/17 20:43

Hi,

I downloaded the Script2015 package and try to reproduce the tests done by jcl. But when I use the bootstrap script after running the batch file for training, the resulting graphics is this:

It does not at all look like the histogram in the blog:


Zorro output is
Code:
Best of 1260 systems
TrendHMA_EURUSD_H4_1_1: 1.28
Bootstrap - please wait..
Sample median: 1.27
P-Value of best strategy: 0.43


can anyone explain that and show me where I went wrong?
Posted By: firecrest

Re: reproducing the trend test from "financial hacker" - 04/14/17 16:39

Hi
I am wondering if you can change this line item and check out the result.

#define BUCKET 0.0005
Posted By: DeusExMachina

Re: reproducing the trend test from "financial hacker" - 04/15/17 07:12

Hi firecrest. I tried that
Code:
#define CURVES	1260
#define SAMPLES	1000
#define BUCKET	0.0005


But the result looks the same as above. Seems like BUCKET is not really used in the Histogram, but Bucket instead:

Code:
void _plotHistogram(string Name,var Value,var Step,int Color)
{
  var Bucket = floor(Value/Step);
  plotBar(Name,Bucket,Step*Bucket,1,SUM+BARS+LBL2,Color);
}


To be honest, I really have difficulties understanding the bootstrap script.
Posted By: DeusExMachina

Re: reproducing the trend test from "financial hacker" - 04/15/17 09:55

I started again from the beginning to do everything step by step in Trend Indicators .
If I wanna generate


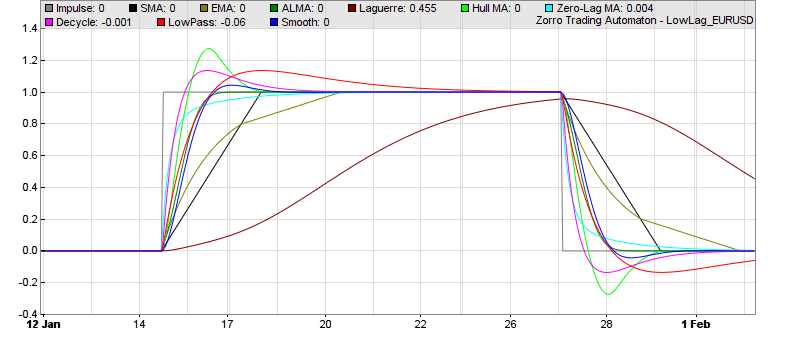
and just copy paste the source code provided by jcl and run it, the resulting graphics is:


Again, I did not code anything, just ran the provided script in zorro 1.54.
This should exactly reproduce the same result. Any ideas?
Posted By: jcl

Re: reproducing the trend test from "financial hacker" - 04/24/17 11:56

Too small histogram: Check if only one of the 10 indicators or only one of the assets was selected. Using data from all indicators and all assets should produce a broad histogram as in the article.

Too small chart: Increase MaxBars.
© 2024 lite-C Forums