Market Meanness Index

Posted By: jcl

Market Meanness Index - 07/24/14 15:56

Every algorithmic trader has the duty to invent an indicator sooner or later, so here's now my contribution, the Market Meanness Index.

Code:
var MMI(vars Data,int TimePeriod)
{
	var m = Median(Data,TimePeriod);
	int i, nh=0, nl=0;
	for(i=1; i<TimePeriod; i++) {
		if(Data[i] > m && Data[i] > Data[i-1])
			nl++;
		else if(Data[i] < m && Data[i] < Data[i-1])
			nh++;
	}
	return 100.*(nl+nh)/(TimePeriod-1);
}


As the name says, this indicator measures the meanness of the market. The theory behind it is that in a completely uncorrelated price series, the probability of a price to revert to the mean is exactly 75%. That means if the current price is above the median price, the next price will be below the current price; and if the current price is below the median price, the next price will be above the current price. This rule is fulfilled for 75% of all prices of an uncorrelated price series. The proof of the 75% is relatively easy.

Real prices are more or less autocorrelated, so the probability of a real price series to revert to the mean is less than 75%, but normally more than 50%. The higher it is, the meaner is the market.

How can this be used for trading? The meanness index can determine when trend following systems become more profitable (market gets less mean) or less profitable (market gets meaner). For instance, you can use the rise or fall of the MMI to filter out unprofitable periods in the simple trend following system of workshop 4:

Code:
function run()
{
	vars Price = series(price());
	vars Trend = series(LowPass(Price,500));
	
	Stop = 4*ATR(100);
	
	vars Meanness = series(MMI(Price,200));
	vars Filter = series(LowPass(Meanness,500));
	
	if(valley(Trend)) {
		exitShort();  // close opposite position
		if(falling(Filter))
			enterLong();
	} else if(peak(Trend)) {
		exitLong();
		if(falling(Filter))
			enterShort();
	}
}


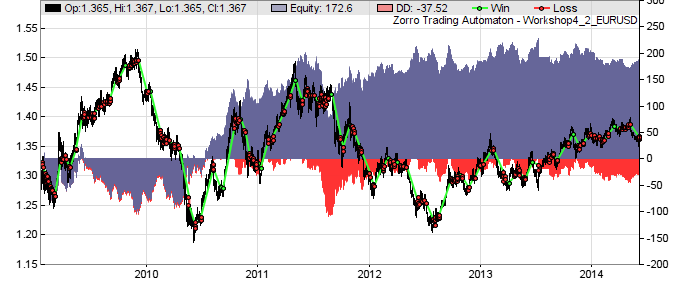
Here's the profit curve without meanness filter - AR 40%:


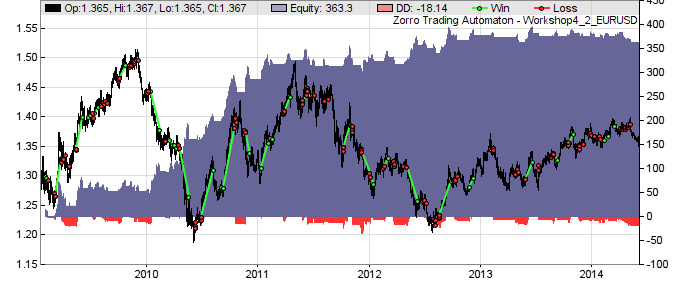
And here with meanness filter - AR 200%:


Enjoy!
Posted By: DdlV

Re: Market Meanness Index - 07/24/14 16:44

Way cool! Thanks, and Congratulations! laugh
Posted By: Sundance

Re: Market Meanness Index - 07/24/14 19:53

Really nice one JCL!! cool
Posted By: boatman

Re: Market Meanness Index - 09/13/14 08:52

Hi JCL,

Thanks for the indicator! This may be a silly question, but I wasn't able to find an answer in the manual or the forum. Is it possible to add the MMI code to the indicators.c file so that it is available to be called in any Zorro script? If so, how does one do this? I have tried copying it directly, but can't seem to get it to work. The Zorro GUI gives me the message: "Unidentified fucntion: MMI"

Thanks again!
Posted By: Sphin

Re: Market Meanness Index - 09/13/14 19:02

Take a look at the "What's new" of the manual: MM will be part of the indicator library as of version 1.26. We only need to be patient let's say one or two months.:)
Posted By: DdlV

Re: Market Meanness Index - 09/13/14 19:49

Hi boatman. Where did you paste it into indicators.c? At the end? Before the #endif's?
Posted By: boatman

Re: Market Meanness Index - 09/13/14 22:04

Thanks for the responses!

After the line

#ifdef INDICATORS_H

I pasted

var MMI (vars Data, int TimePeriod);

The after

#else
//Helper functions and and definitions

I pasted the code for the MMI.
Posted By: DdlV

Re: Market Meanness Index - 09/13/14 22:08

Hi boatman. It works for me if I just paste the whole MMI from above in between the 2 #endif's.

HTH.

EDIT: But I think the right way is to put it above both #endif's and duplicate the definition line above the #else, adding the ";". laugh
Posted By: boatman

Re: Market Meanness Index - 09/15/14 00:25

Thanks DdlV, much appreciated!
Posted By: bfleming

Re: Market Meanness Index - 09/22/14 08:58

And be extension, wouldn't it make sense to filter counter-trend strategies to trade when the market is more mean?
Posted By: jcl

Re: Market Meanness Index - 09/22/14 11:32

We've tested this also, but it won't improve a CT strategy. Reason is that "more mean" can also mean "more random".
Posted By: forexcoder

Re: Market Meanness Index - 03/22/15 10:48

Thanks Jcl for the code. You are GREAT!!!!!
Posted By: MatPed

Re: Market Meanness Index - 03/22/15 14:21

Good work, but please, some marketing please! You should have called it Market Madness Index laugh
Posted By: Sphin

Re: Market Meanness Index - 03/22/15 17:59

Quote:
The theory behind it is that in a completely uncorrelated price series, the probability of a price to revert to the mean is exactly 75%

Can someone please tell me where this statement comes from? A hint to its math. base might be also sufficient.

Thanks, Sphin
Posted By: boatman

Re: Market Meanness Index - 03/23/15 03:48

Quote:
The theory behind it is that in a completely uncorrelated price series, the probability of a price to revert to the mean is exactly 75%


Uncorrelated with what? Or are you referring to a random walk process?
Posted By: jcl

Re: Market Meanness Index - 03/24/15 15:09

Yes. Uncorrelated with itself, i.e. Price(today) has no correlation to Price(yesterday). Then you'll get the 75% mean reversion probability.

You can prove this with a simple geometrical consideration. Suppose you have a set of today's prices Pt, and a set of yesterday's price Py. By definition, half the prices from Pt are below the median and half are above the median; same for Py. Now combine the two sets to a 2 dimensional set of vectors with coordinates (Pt,Py). Every such vector represents a possible price change from Py yesterday to Pt today. This set of price changes can then be split by the median lines into 4 sub-sets:

1. (Pt < Median, Py < Median)
2. (Pt < Median, Py > Median)
3. (Pt > Median, Py < Median)
4. (Pt > Median, Py > Median)

The 4 subsets have exactly the same number of elements when Pt and Py are uncorrelated. The value of the median does not matter.

Now, mean reversion, or more precisely moving in direction to the median value means the following condition:

(Pt > Py and Py < Median) // yesterdays Price was below the median and rises, i.e. todays price is higher
or
(Pt < Py and Py > Median) // yesterdays Price was above the median and falls


The first condition is fulfilled in half of subset 1 (the other half had Pt < Py) and in the full subset 3 (because Pt > Py always in subset 3). So, this happens for 1/2*1/4 + 1/4 = 3/8 of all elements.

The second condition is fulfilled in half of subset 4 (the other half had Pt > Py) and in the full subset 2 (because Pt < Py always in subset 2). This is true for another 3/8 of all elements.

3/8 + 3/8 = 6/8 = 75%.
Posted By: GPEngine

Re: Market Meanness Index - 03/26/15 02:47

Then, would it be accurate to say
"The theory behind [MMI] is that in an uncorrelated price series, the probability of a price to revert to the median on the next sampled bar is exactly 75%"
Posted By: jcl

Re: Market Meanness Index - 03/26/15 14:39

Yes, that is correct.
Posted By: Sphin

Re: Market Meanness Index - 03/27/15 22:55

Sometimes I need a little longer, sorry for that. But mean reversion can be tricky and I'm interested in understanding your derivation.

Quote:
Suppose you have a set of today's prices Pt, and a set of yesterday's price Py. By definition, half the prices from Pt are below the median and half are above the median; same for Py.

You are talking of 2 sets of prices Pt/Py like in bars of today/yesterday and there are 2 medians, one for the set Pt and one for the set Py?

Quote:
Now combine the two sets to a 2 dimensional set of vectors with coordinates (Pt,Py).

Combining arbitrarily or each one of Pt with each one of Py?

Thanks, Sphin
Posted By: GPEngine

Re: Market Meanness Index - 03/28/15 03:16

The 2 medians should be substantially the same. The Py is calculated from all the same values as Pt, except 2, at the edges. So is safe to speak of only one median.

... and in pairs in the natural order so that the sense of each pair is (Pt,Py), over time.
Posted By: Sphin

Re: Market Meanness Index - 04/18/15 17:34

Then I think in a wrong direction, okay I will try it once again, anytime.

Meanwhile a more practical question: in the example begin of this thread jcl calculated:

Quote:
vars Trend = series(LowPass(Price,500));

vars Meanness = series(MMI(Price,200));
vars Filter = series(LowPass(Meanness,500));


Is there a relationship between the 500 periods of the LowPass-Filter for the price defining the trend, the 200 of the Meanness and the 500 for smoothing the Meaness? Is there a 'universal' ratio or is it rather a matter of optimization?

Thanks, Sphin
Posted By: Mithrandir77

Re: Market Meanness Index - 07/11/15 21:29

Hi jcl, I noticed that in include.c the code for MMI is:

Code:
var MMI(var* Data,int TimePeriod)
{
	TimePeriod = Min(TimePeriod,1000);
	var m = Median(Data,TimePeriod);
	TimePeriod = Min(TimePeriod,g->nBar);
	if(TimePeriod <= 2) return 75;
	int i, nh=0, nl=0;
	for(i=1; i<TimePeriod; i++) {
		if(Data[i] > m && Data[i] > Data[i-1])
			nl++;
		else if(Data[i] < m && Data[i] < Data[i-1])
			nh++;
	}
	return 100.*(nl+nh)/(TimePeriod-1);
}


Why are these lines added?

TimePeriod = Min(TimePeriod,1000);
TimePeriod = Min(TimePeriod,g->nBar);
if(TimePeriod <= 2) return 75;
Posted By: jcl

Re: Market Meanness Index - 07/13/15 07:22

Safeguards. The first line limits the time period to 1000, which is needed for the Median function. The second line limits it to the data that's really available and the third line sets a lower limit for the time period.
Posted By: Mithrandir77

Re: Market Meanness Index - 07/13/15 17:13

Thanks for the explanation!
Posted By: royal

Re: Market Meanness Index - 09/29/15 09:05

I have a few questions concerning the MMIPeriod:

1. In the forum you use 200 and 500 as periods, in the manual 300 and 500 and in the financial hacker blog an optimized value (200-500) which is the same for both.
As Sphin already asked is there a 'universal' ratio or is it rather a matter of optimization?

2. When I want to use the MMI with daily bars, should I also use the 200-500 range, or should I break it down to 8-21? (~200/24-500/24)
Posted By: jcl

Re: Market Meanness Index - 09/29/15 10:20

The time period is a compromise: It should be longer than about 100-200 bars, otherwise the measure is not precise enough. But it should not be too long, such as much more than 500 bars, otherwise the period can cover several different market changes. It does not depend on the bar period because any bar period establishes a different market with different rules. The same asset can be trending with daily bars, but mean reversing with 1-hour bars.
Posted By: royal

Re: Market Meanness Index - 09/29/15 11:06

Thanks for the answer, I will play around a bit with the 200-500 range laugh
© 2024 lite-C Forums